How To Effectively Use Data Loggers For Warehouse Temperature Mapping
What Is Warehouse Temperature Mapping?
Warehousing temperature mapping is a regulatory process that is performed to understand temperature that is maintained within warehouse storage and distribution facilities. The temperature and humidity levels of a warehouse are mapped out and recorded in order to protect temperature-sensitive goods such as biopharmaceuticals and other perishables items. Pharmaceuticals for example generally have to be kept in an environment with temperatures ranging from 2°C to 8°C.
In order to mitigate the risk of these products losing their effectiveness or unsafe for use, it is important to understand if set thresholds are maintained throughout areas of the warehouse. This is where temperature mapping equipment like data loggers enter the conversation. A data logger is a small device that can collect data on a range of metrics and is usually linked to a software platform/portal to access data. Some devices are able to provide near real-time data in regular intervals to the user on vital metrics including location, temperature, humidity, and tampering to name a few.
How Can You Make Use Of Data Loggers For Warehouse Temperature Mapping?
Data loggers can be used for much more than simple track and trace functions. In fact they can be utilised for temperature mapping in warehouse storage and distribution facilities. They are usually placed around the cold storage facility for at least 24 hours however are commonly monitored for longer in order to understand if temperature and humidity is consistent throughout. The thermal mapping equipment assists in a greater understanding of patterns such as temperature range and temperature fluctuations and hot & cold areas within the warehouse facility. When utilising data loggers for warehouse temperature mapping, it is common to follow a step-by-step guide such as the below:
Step 1: Select a temperature monitoring device
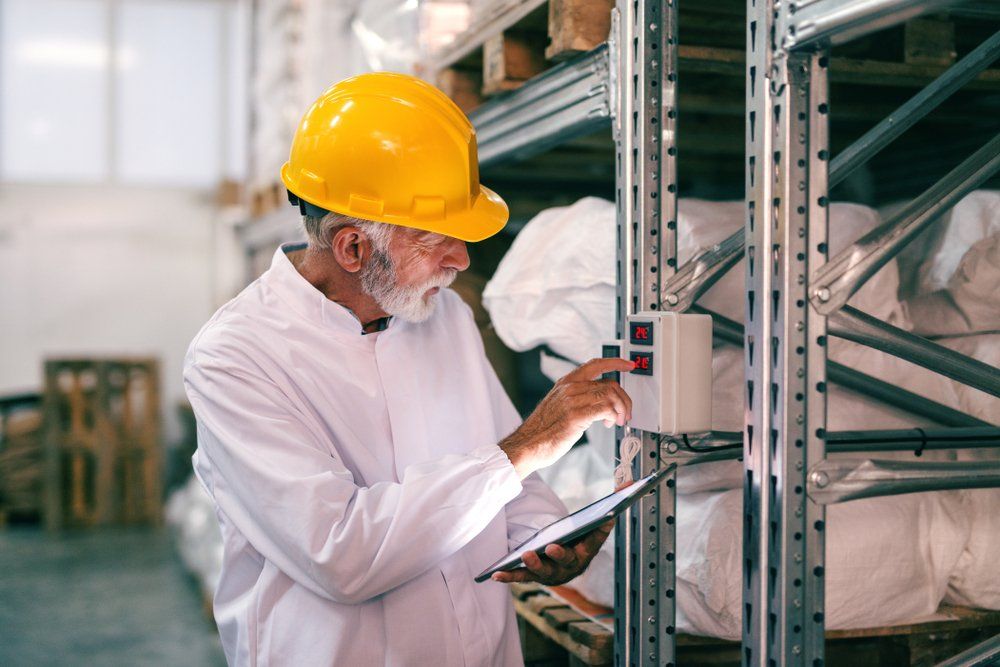
When selecting data loggers for warehouse temperature mapping, there are a few things that must be considered. The company should ensure that the device is able to provide temperature and humidity data in near real-time. This data should also be transmitted to a portal where the client can easily access data that can later be exported and stored for record keeping purposes as well as to be referred to in case any changes need to be made to their cold chain management processes.
Step 2: Locate areas of risk
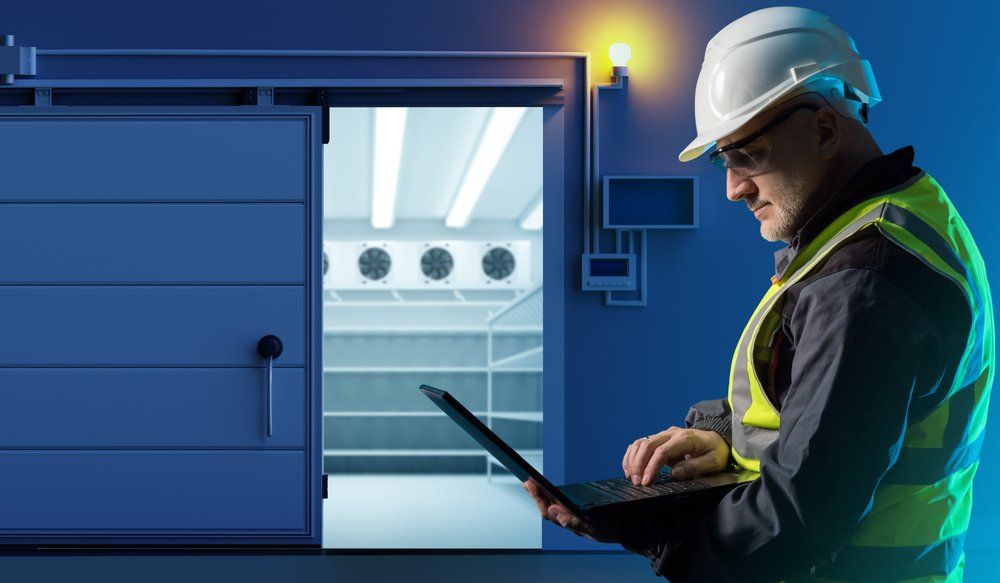
There are a variety of factors that can cause fluctuations in temperature and humidity within a cold storage and distribution facilities. A few examples include large volumes of space, machines that produce cold or hot air (such as fans, air conditioners, heaters etc), layout of shelving, and entries or exits to the building including doors, windows, and vents. All of these elements can play a part in causing fluctuations in environmental conditions and therefore are areas where temperature mapping is needed the most.

Step 3: Decide on sensor distribution locations
The next part of utilising data loggers for warehouse temperature mapping is to select how many sensor devices are required and where they must be placed. This depends on the size and shape of the warehouse, as well as furniture and door/window placements. They must be uniformly and evenly spaced out throughout the storage facility, and cover all three dimensions of the space including width, length and depth.
Step 4: Set up and conduct the test
Once the sensor locations are confirmed, data loggers can be carefully placed at each point and simultaneously turned on to commence the data collection process. Ensure that the devices are properly calibrated, validated and charged to full capacity. Also making sure to set up data collection intervals on the software platform and testing that the data is able to be accurately collected and downloaded is important to enhance the validity of the warehouse temperature mapping process.
Step 5: Record results, upload and review the data collected
Once the test is performed, simply access, download, and view the data transmitted based on the temperature and humidity of the sensor location points. This metric-based data should include information such as readings, graphs, timings and more. Note any possible variations or errors during the data collection process and associated changes that can be applied for the next testing period.
Step 6: Repeat the process with modifications
If the results from the test show extensive variations and unacceptable conditions, the mapping process can be repeated once appropriate modifications are made to the environment. Otherwise, it is usually encouraged that warehouse temperature mapping be repeated every 3 months to a year, although this can depend on several factors including protocols that are dictated and products being stored. In order to maintain constant variables during each iteration of testing, consider factors such as time of year. Seasonal changes in temperature and humidity as well as increased use of heating or cooling units will heavily impact the results of the test.
There may be additional steps involved in the process depending on the individual protocols of the company, but these are generally the most commonly followed and adhered to.
Why Is Warehouse Temperature Mapping Such An Imperative Process To Undertake To Support Cold Chain Management Processes?
Warehouse temperature mapping is an imperative process that must be followed accurately and may be required frequently as it helps to maintain specific temperature ranges and determine whether the storage environment is fit to safely store temperature-sensitive goods. If it is not performed properly or scheduled mapping is missed or delayed, this can lead to unrecorded fluctuations in temperature and humidity and can lead to loss of temperature-sensitive products due to variations of set conditions.
How Can Adapt Ideations’ Data Loggers Support The Warehouse Temperature Mapping Process?
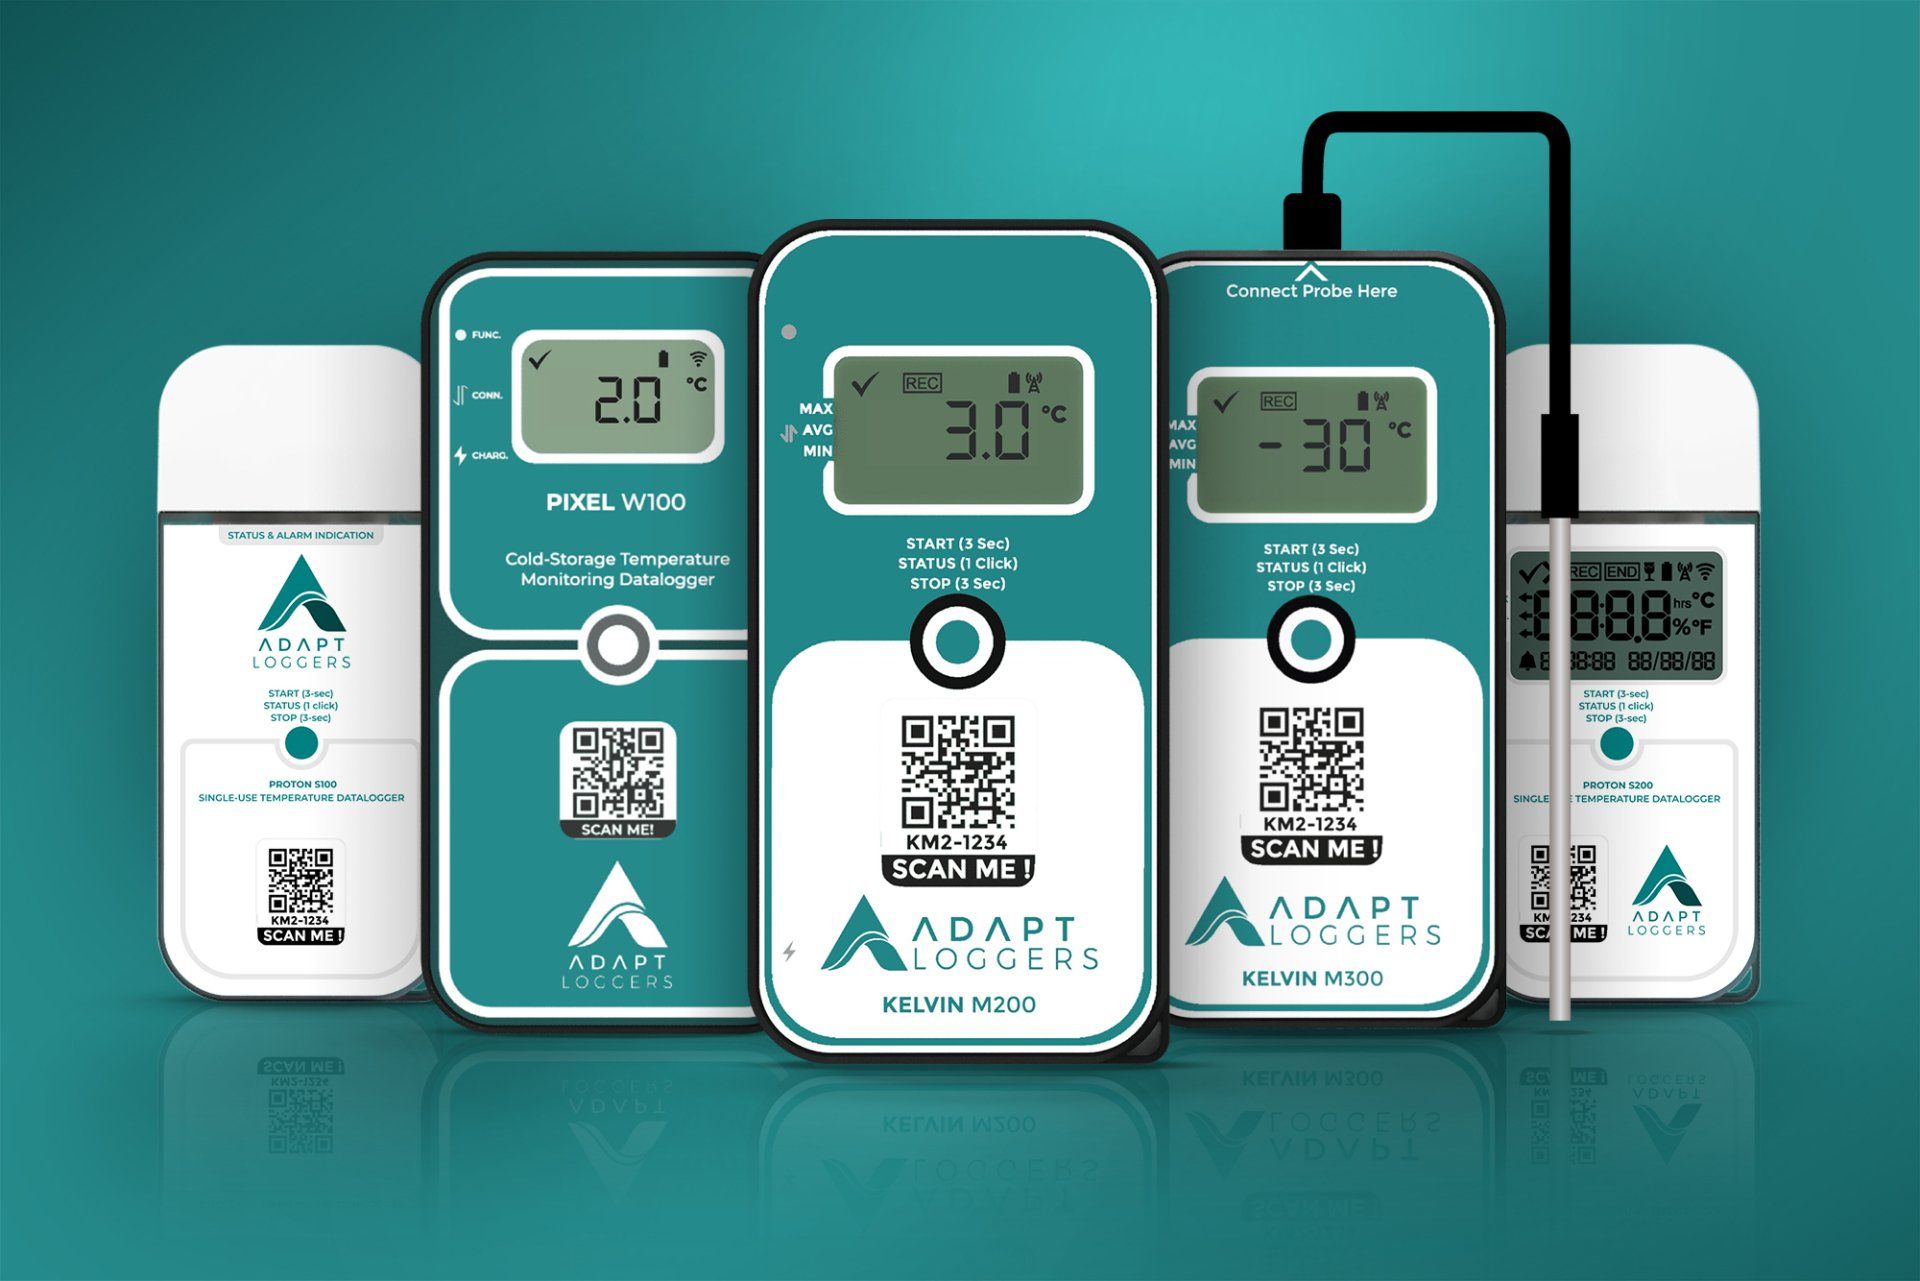
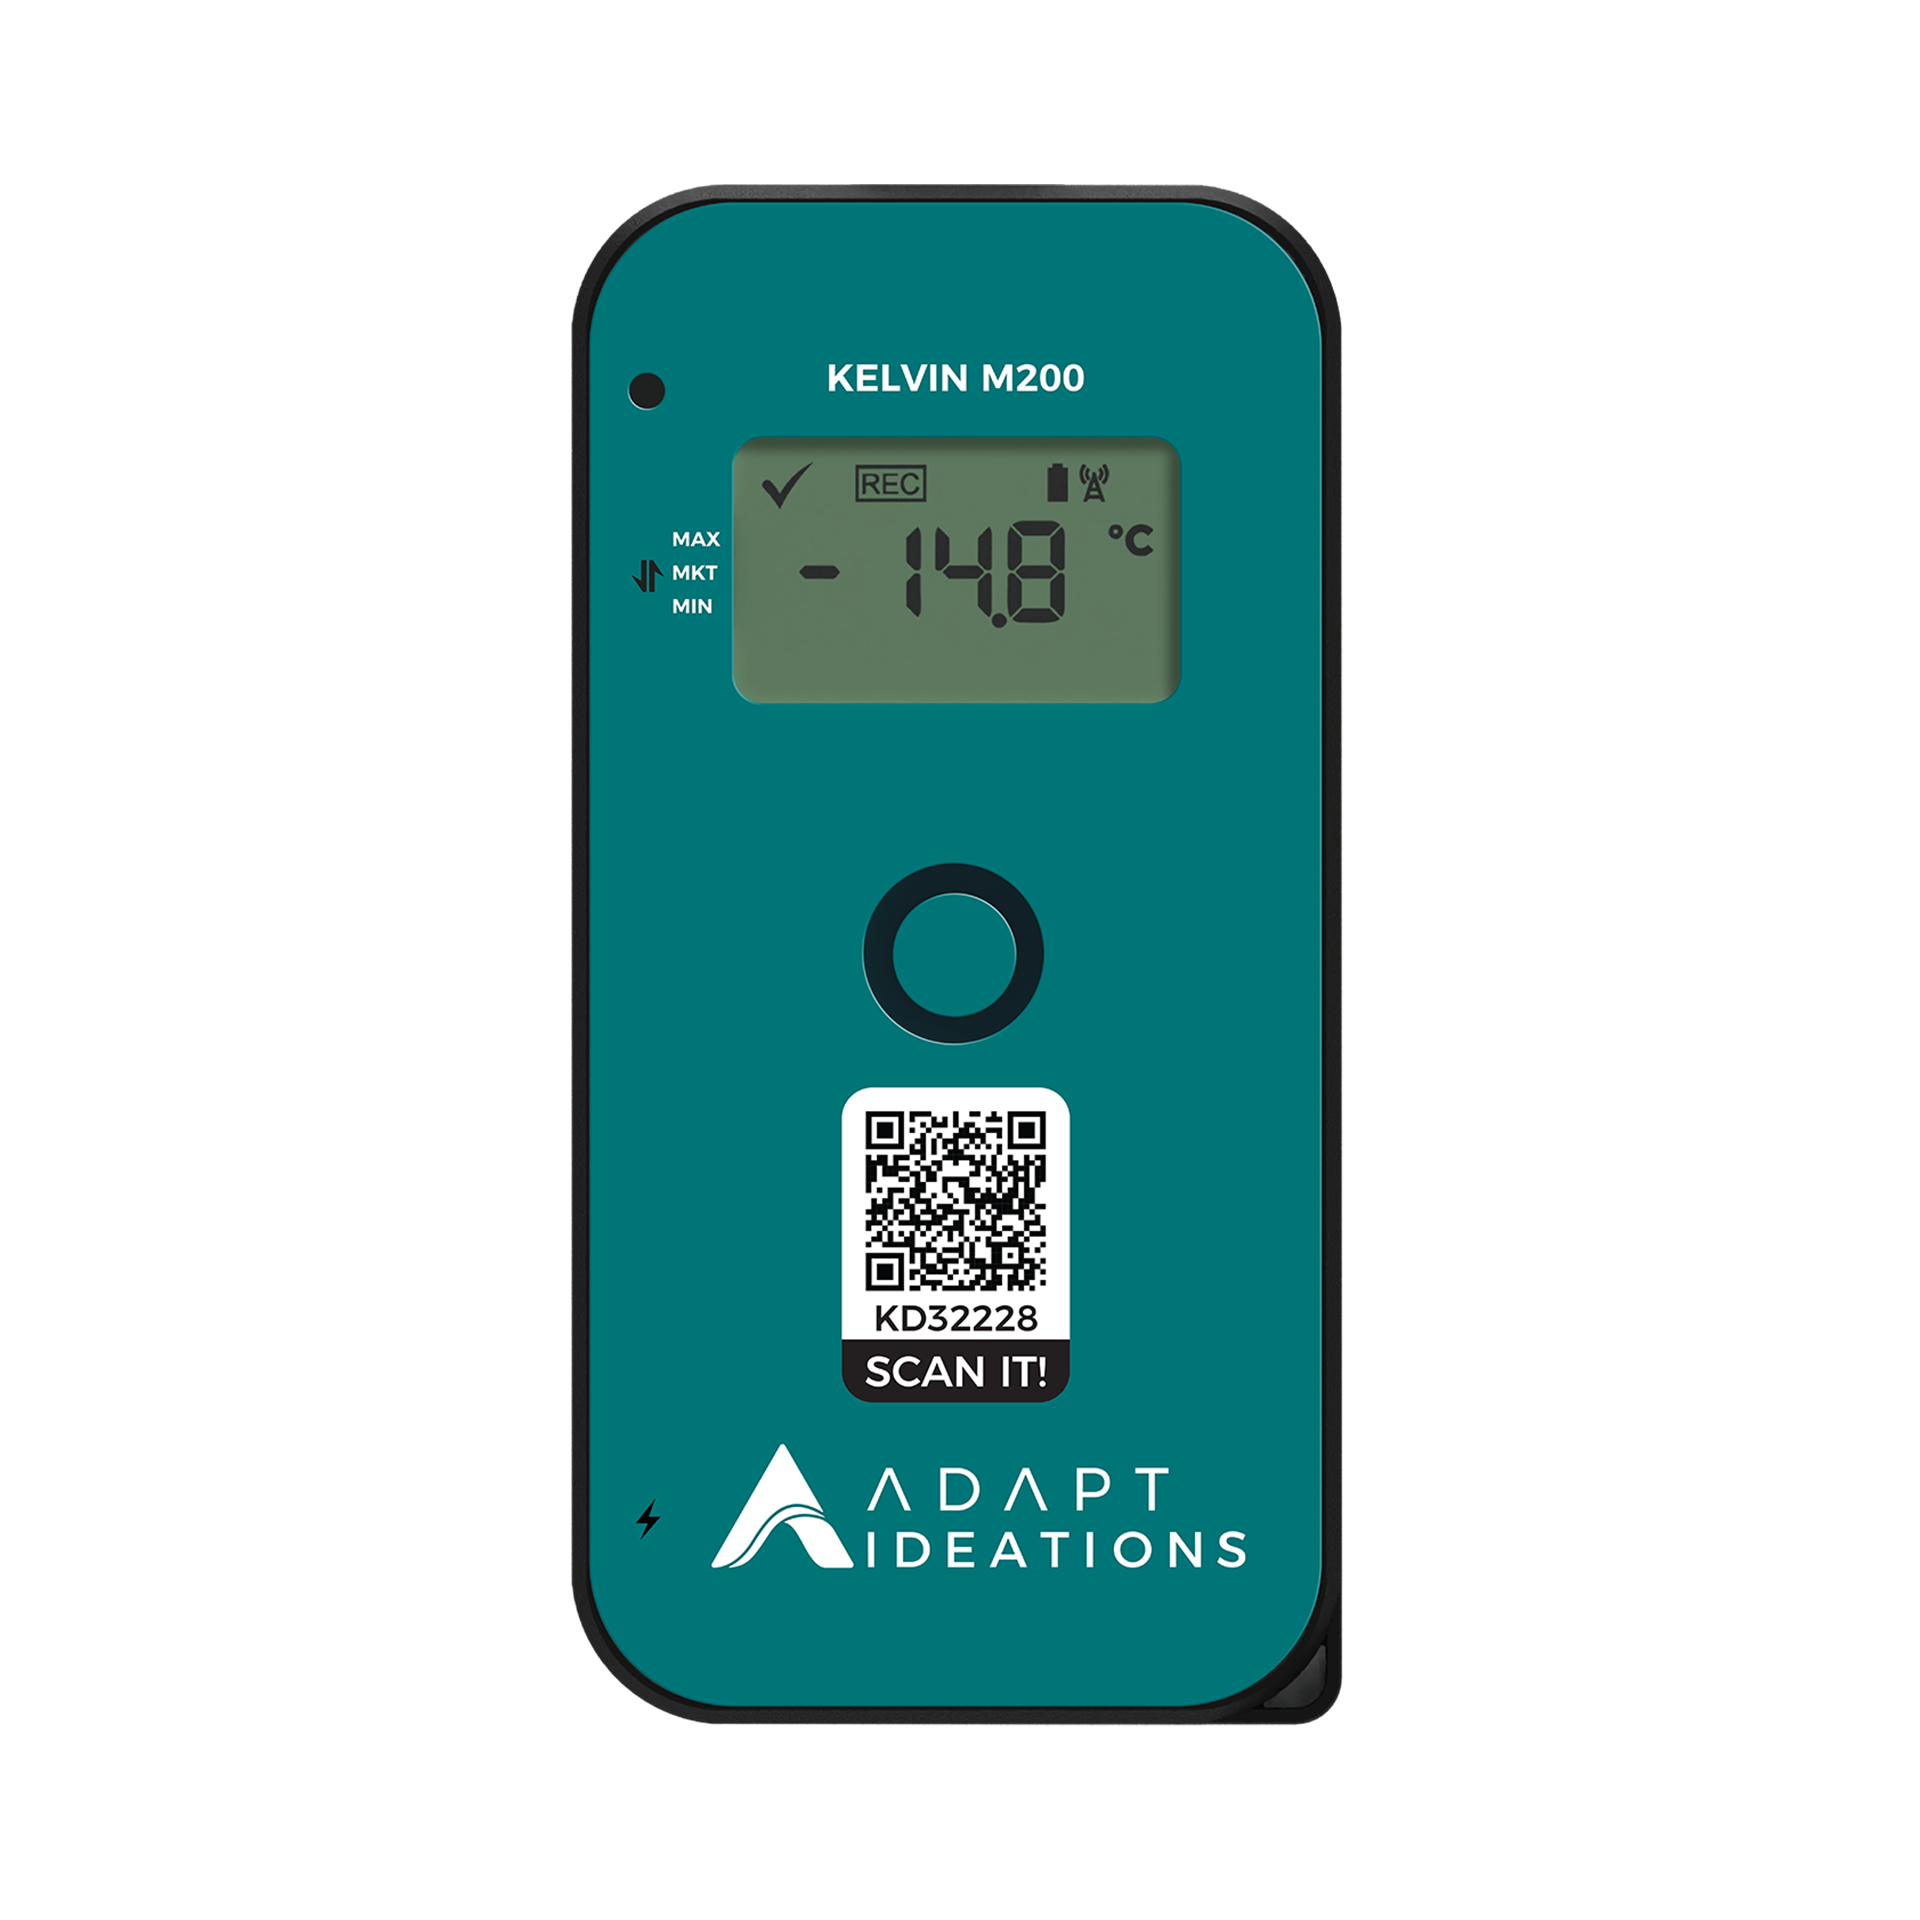
As discussed, data loggers are an integral part of the warehouse temperature mapping process. Without a trustworthy and accurate device to monitor the variations in temperature and humidity, there is no way to identify weaknesses within the warehouse and rectify those issues. Here at Adapt Ideations, we have innovated a device that is built solely to monitor temperature and humidity in cold storage facilities. The PIXEL solution range ensures that immediate action can be taken with its near real-time alerts when set parameters are violated, therefore reducing the amount of potential damage and waste of products whilst in storage when violations occur.
Get in touch with us today at enquiries@adaptideations.com for further information on our innovative solutions.
Powerful and reliable, asset tracking and monitoring solutions.
Innovative monitoring solutions for high-value & temperature-sensitive assets.
Share Our Post.
Awards & Recognition

Best Temperature Monitoring Solution Provider
Awarded by India Biologics & Vaccines Outstanding Industry Awards 2022

Adapt Ideations Recognised As A Supply Chain Leader
by Alcott Global on Supplify's Supply Chain Tech Map 2.0
Related Articles.


Our Guides.